AEInfoGraphics 2
-
Compatibility After Effects Please check exact version compatibility under the "COMPATIBILITY" tab below
 Adding to cart...
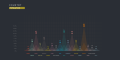
AEInfoGraphics is an AfterEffects extension that converts your data into amazing and beautiful chart animations. It allows you to import csv files directly to After Effects. You can also create your own tables in AE using AEInfoGraphics's easy to use interface. Select from twelve beautiful chart templates to generate your chart composition. That is all! Your chart animation is ready to use!
What's new in AEInfoGraphics 2
- Preview Feature
A powerful preview feature comes with this new version. You can easily see your final output before creating it.
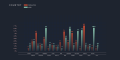
- Multiple Data Sets
For selected charts there is multiple data set support. Now you can compare two sets of data in a single chart.
- Timing
Animation and Composition durations can be set.
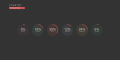
- Labeling
You can set the label type shown on charts (values or percentages)
- Save Option
You can save your data as well as all your settings. You can load them anytime you want.
Very easy to use
Watch video tutorials by clicking on the VIDEOS tab above
Step 1: Create Data
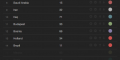
There are two ways to create data with AEInfoGraphics. You can import csv files directly to After Effects or you can create your own table by using AEInfoGraphics interface. Either way you will be able to see your data listed in the AEInfoGraphics panel.
Step 2: Choose Your Column
If you choose the first way, you should select the data column(s) from “Choose Data” located in the upper right corner.
Step 3: Arrange Data
You can edit your data by adding, removing or reordering items. You can directly edit titles and values simply by clicking on them.
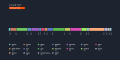
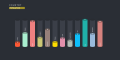
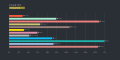
Step 4: Choose Your Template
There are twelve different types of chart templates. Some of them allow you to use multiple data sets. You can see these templates in action with the new preview feature in order to decide on the most appropriate one for your data. (Four chart templates have no preview feature!)
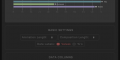
Step 5: Setting and Preview
In this modal view there are basic settings, data columns list, templates and themes. There are 9 beautiful color theme. These can also be previewed in the preview screen. You can determine animation and composition durations and choose an option for labels (Value or Percentage).
Step 6: Create Chart
Now everything is ready to create your chart. Just press the “Create Now” button.
Step 7: Modify Chart Comp
When you press the button, the composition will open in the viewer with one visible layer called ‘PARENT’. (Other layers are hidden for clarity purposes). Select that layer to see the controls. Colors, positions etc. can be changed via these controls.


Upgrade Notice
If you purchased AEInfoGraphics 1 after Jul 1 2017, you can upgrade for free. If you purchased it before the upgrade price is $25. To get the discount login to the same account you purchased v1 with and you will see the discounted price automatically. If you have any questions or issues please open a support request.


| After Effects | 2024, 2023, 2022, 2021, 2020, CC 2019, CC 2018, CC 2017, CC 2015.3, CC 2015, CC 2014 |
|---|
2.0.3 (Current version) - Oct 23, 2019
2.0.2 - Jan 29, 2018
2.0.1 - Jan 29, 2018
-

Data Storyteller
Add to CartData Storyteller is a data visualization plugin set designed to easily turn data into animations.
From: $199.00
-

- Compatibility After Effects
Ticker
Add to CartCreate Ticker or Crawl in 2 clicks in After effects! Use starter templates formatted in CSV, TSV or JSON. Has full RTL Support! Try 5 lines for Free!
-

- Compatibility Premiere
Text Replacer for Premiere Pro
Add to CartImport and export text in Premiere Pro from your After Effects templates!
-

- Compatibility After Effects
Templater Pro Subscription Annual Recurring
Templater Pro extends Templater Rig by offering desktop automation, allowing you to render or replicate batches of versioned compositions using your data source. Monthy Recurring as well as1, 3, 6, or 12 month licenses are also available.Add to Cart$2,250.00 As low as: $1,350.00 -

- Compatibility After Effects
Speed Lines
Add to CartThe fastest way to attach strokes to your animated object.
$14.95 -

- Compatibility After Effects
quadrateFX
Add to CartGenerate random patterns of vector tiled rectangles in After Effects, simulating the data visualization method also known as treemapping.